
585.204.6770
sale@sanblueplastics.com
Your Source for Trays!
China’s UV spectroscopy market includes manufacturers serving research laboratories, factories, and routine quality-control teams. Comparing the top 10 requires more than scanning product photos or headline specifications. A Uv Spectroscopy Machine must produce dependable measurements under real working conditions. Small details matter.
Physicist Richard Feynman offered a useful warning for anyone assessing scientific results: “The first principle is that you must not fool yourself—and you are the easiest person to fool.” That caution fits instrument selection, too. A broad wavelength range may look impressive, but buyers should also examine wavelength accuracy, spectral bandwidth, stray-light performance, and baseline stability. Ask how the instrument handles blank measurements, repeated scans, and routine calibration. A clear display helps, but reliable data matter more.
This guide reviews ten Chinese manufacturers through practical criteria, including product range, published specifications, application support, and service availability. It also considers concrete needs, such as measuring a sample in a quartz cuvette or transferring results into laboratory software. Not every catalog reveals the full picture. Specifications may use different test conditions, and support can vary by location. Treat this list as a starting point, not a universal ranking. Check claims against technical documents, demonstrations, and your own sample requirements before making a decision.
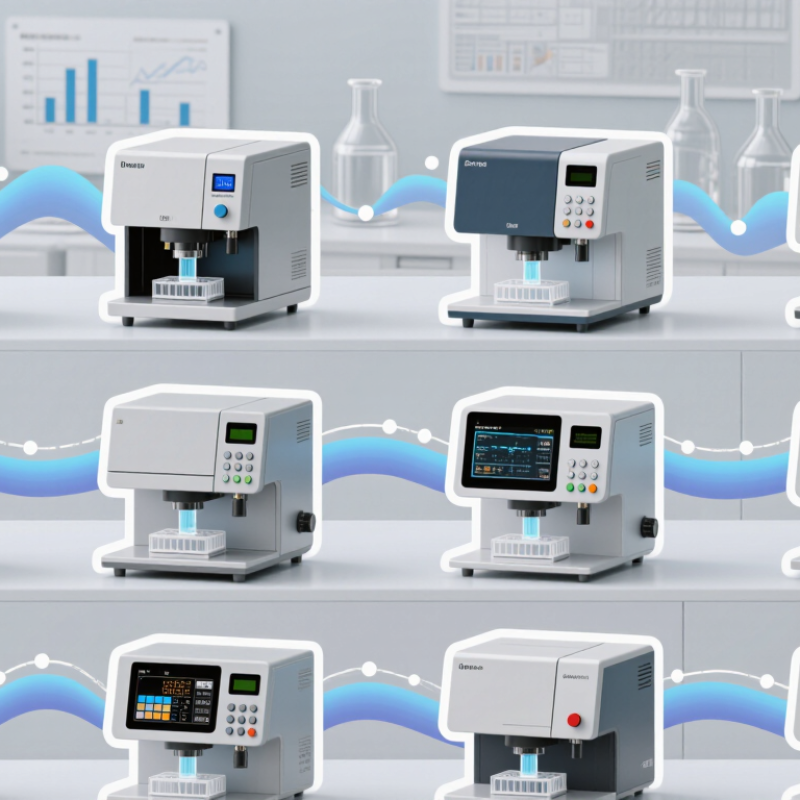
UV spectroscopy machines measure how much ultraviolet light a sample absorbs or transmits at selected wavelengths. The resulting spectrum can help identify compounds or estimate their concentration. In routine work, an operator places a clear sample in a cuvette, selects a wavelength, and compares the reading with calibrated standards. Simple, but not foolproof: cloudy samples and dirty cuvettes can distort results.
These instruments support pharmaceutical quality checks, chemical analysis, food testing, and water monitoring. For drinking-water analysis, U.S. EPA Method 415.3 specifies absorbance measurement at 254 nm and combines it with dissolved organic carbon data to calculate specific UV absorbance. This indicator helps characterize organic matter in source water; it does not identify every contaminant. ASTM E275 also provides guidance for describing and evaluating UV-visible spectrophotometer performance. Calibration and suitable blanks still matter. A neat spectrum is not proof of a correct result.
Tips: Wipe both cuvette faces before measurement. Match the blank to the sample solvent, and record wavelength, path length, and temperature. If readings drift, check the lamp and sample clarity before trusting the trend.
A UV spectrophotometer measures how much ultraviolet or visible light a sample absorbs at selected wavelengths. Inside, a deuterium lamp supplies ultraviolet light, while a tungsten-halogen lamp commonly covers visible wavelengths. A diffraction-grating monochromator isolates a narrow band; a quartz cuvette holds the sample, often across a 10 mm path. A detector converts transmitted light into an electrical signal.
Absorbance follows Beer–Lambert behavior: A = εbc, linking concentration and path length with measured absorption. That relation is useful, but only when the blank, cuvette, and wavelength setting are controlled. Fingerprints matter. Even slight residue can distort a low-concentration reading. Routine checks should include wavelength accuracy, photometric response, and stray light, as outlined in USP General Chapter <857>.
For traceable wavelength checks, NIST SRM 2034 provides certified holmium-oxide absorption lines across approximately 240–650 nm. That span helps verify the monochromator, not the whole method. Sample chemistry still matters. Acidic matrices, turbidity, and bubbles can shift or scatter the signal; operators should inspect baselines and replicate readings. A neat spectrum is not proof.
China’s UV spectroscopy manufacturing landscape is supported by a broad base of optical, electronic, and analytical-instrument suppliers. Domestic makers compete on price and delivery, while product quality depends on quieter details: wavelength accuracy, stray-light control, detector stability, and repeatable calibration. A polished enclosure means little if a measurement drifts between runs.
The National Bureau of Statistics’ 2024 Statistical Communiqué reports national R&D spending of 3.613 trillion yuan, equal to 2.68% of GDP. This signals a substantial research base, but it does not measure UV spectrometer output or local market share. That distinction matters. Public data rarely separate UV-visible instruments from wider analytical equipment categories, so sweeping claims about “top” manufacturers deserve scrutiny. Buyers should compare test methods, service coverage, and traceable calibration records—not just advertised wavelength ranges. Small details matter.
Tips: Ask for a sample test report, including wavelength accuracy and photometric repeatability. Check how often calibration is recommended, and whether local technical support can resolve a baseline drift problem. A limitation worth noting: published specifications do not always predict performance in a busy laboratory.
This overview summarizes common UV-Vis instrument technologies and manufacturing considerations. It is not a company ranking; no company or brand names are included.
| No. | Landscape dimension | Common configurations or facts | Practical evaluation point |
|---|---|---|---|
| 1 | Wavelength coverage | Many UV-Vis instruments cover portions of the ultraviolet and visible regions; a common benchtop range is approximately 190–1100 nm. | Confirm the usable range and performance specifications for the exact model and application. |
| 2 | Optical arrangement | Single-beam and double-beam designs are both used. Double-beam systems compare sample and reference signals during measurement. | Compare measurement workflow, baseline stability, throughput, and maintenance needs. |
| 3 | Light sources | Deuterium lamps are commonly used for ultraviolet wavelengths, while tungsten-halogen lamps are commonly used for visible and near-infrared wavelengths. | Check lamp replacement procedures, expected service life, and whether the instrument switches sources automatically. |
| 4 | Wavelength selection | Scanning instruments commonly use a monochromator; array-based instruments can record multiple wavelengths across a detector array. | Choose based on scan speed, spectral range, and the measurement methods required. |
| 5 | Spectral bandwidth | Spectral bandwidth describes the wavelength interval passed by the optical system. Available settings vary by instrument design and model. | Match the specified bandwidth to the resolution needs of the method; narrower bandwidth is not automatically better for every test. |
| 6 | Sample cells | Quartz cells are commonly used for UV measurements. Glass and many plastic cells are generally suited to visible-range work, subject to their transmission properties. | Verify cell material, path length, and compatibility with the sample and measurement wavelength. |
| 7 | Detector technology | Photodiode and photomultiplier-based detectors are used in UV-Vis instruments; detector choice affects sensitivity, dynamic range, and instrument design. | Review model-specific signal-to-noise and photometric specifications under relevant conditions. |
| 8 | Measurement modes | Common functions include absorbance, transmittance, wavelength scanning, and concentration measurements using a calibration or analytical method. | Confirm that the software supports the required methods, data export, and reporting workflow. |
| 9 | Sample throughput | Manual cell holders, multi-cell changers, and microplate accessories are available across different instrument configurations. | Assess sample volume, batch size, temperature control, and accessory compatibility. |
| 10 | Quality and support | Calibration, performance verification, documentation, user training, and access to service are important considerations for laboratory instruments. | Request model-specific specifications, service terms, calibration documentation, and details of local technical support. |
Profiles of ten Chinese UV spectroscopy machine manufacturers reveal a varied market rather than one uniform product range. Some focus on routine bench-top instruments for teaching laboratories and quality checks. Others develop double-beam systems for steadier baseline measurements. A few specialize in compact units, where a small sample volume matters. Small details count. Look for stated wavelength ranges, spectral bandwidth, stray-light limits, and repeatability data—not just a polished screen. Ask whether specifications come from documented testing.
Several manufacturers also supply software, installation guidance, and local service. These can matter as much as optical design when instruments run daily. One profile may emphasize automated sample handling; another may offer models suited to production-line monitoring. There are trade-offs. More features can mean more training and maintenance. Before comparing suppliers, check whether the quoted configuration includes a computer, validated methods, cuvettes, and calibration support. Request a sample report and clarify how performance is tested across the instrument’s full wavelength range. Published details vary, and sales descriptions do not always explain real operating conditions. A careful buyer should verify service response times and spare-part availability in writing.
When comparing China’s UV spectroscopy machine manufacturers, judge the complete measurement system—not just its wavelength range. Ask for documented wavelength accuracy, photometric accuracy, stray-light limits, and baseline stability. Request test results from the exact instrument configuration you plan to buy. Numbers matter.
MarketsandMarkets’ 2023 spectroscopy market report estimated the broad global spectroscopy market at about US$18 billion in 2023, with growth projected through 2028. This is not a UV-only figure, but it reflects rising demand for dependable analytical measurements. Check whether the supplier’s specifications align with your methods and recognized guidance, such as USP General Chapter <857>. Ask how calibration is performed, which standards are used, and whether reports are traceable. A polished brochure is not evidence.
Technical support deserves equal scrutiny. Ask for a sample service record, typical response times, spare-parts availability, and training options. Confirm whether engineers can diagnose lamp, detector, or software issues remotely—and when an on-site visit is possible. If your samples vary in color or concentration, request a demonstration using representative materials. Watch the baseline drift during a warm-up, then inspect repeatability across several scans. Small gaps matter. I would also ask existing users about support after the warranty ends; this detail is easy to overlook, and supplier claims alone may not reveal it.